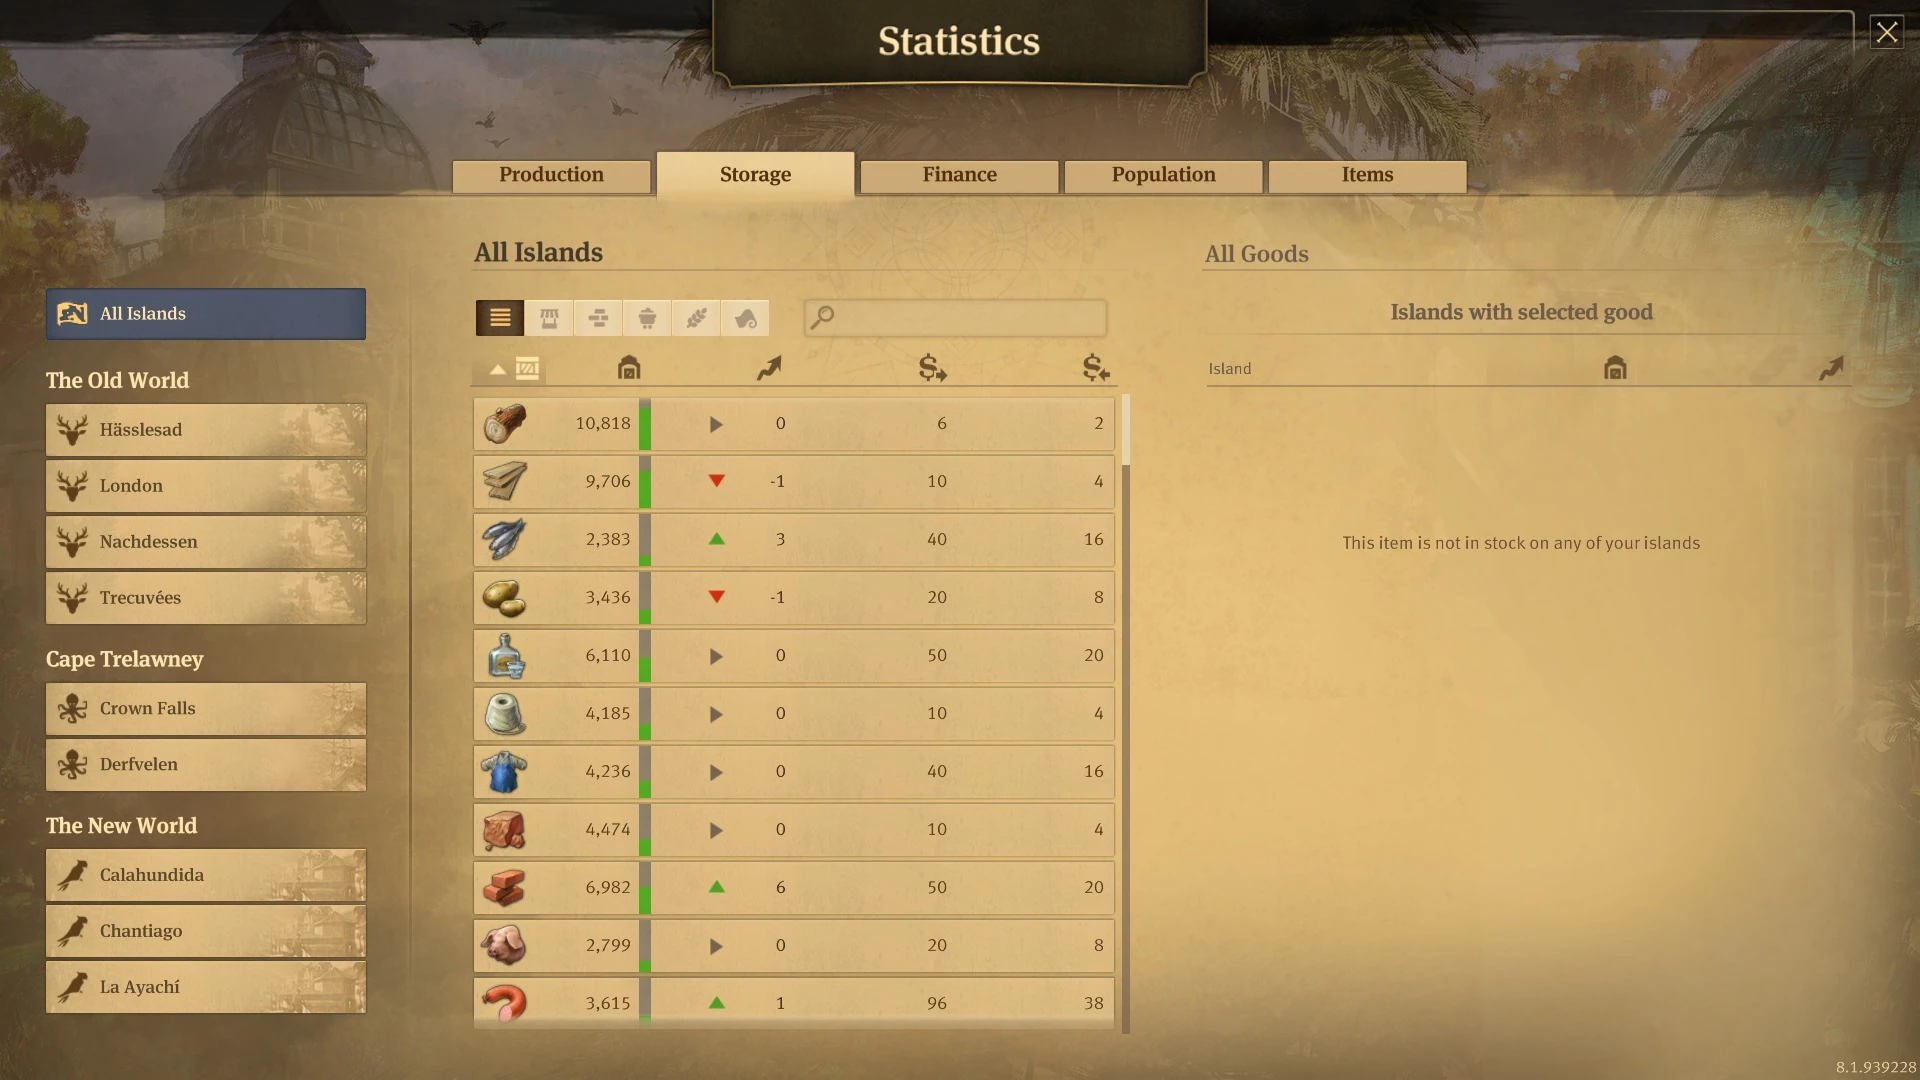
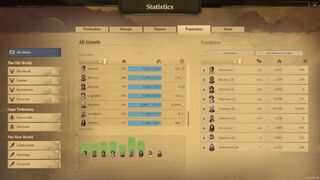
Statistics menu is a detailed overview of your whole empire, that was introduced into Anno 1800 with the patch 6.0 in December 2019. It contains a lot of information about each island you own, your population, production, finances, trade, ships, trade routes, items etc.
Usefulness[]
Statistics menu is a very powerful tool which provides an overview of almost every single part of your empire and it can be accessed at any moment and from every place within the game. It consists of five tabs, each of them providing a specific set of information. All tabs combined provide almost everything you ever need to know to successfully manage and develop your empire.
One of the most common and best uses of the statistics menu is to establish a proper balance between the production and consumption of goods. It can be achieved by comparing production and consumption rates displayed in the production tab. When goods are also moved between islands, it is important to assess how many tons per minute on average are transported. Such assessment is possible due to the storage tab and the trade routes section, there you can see when ships from trade routes arrive to a specific island and how many tons they load/unload, based on that data you can calculate how many tons per minute are being transported.
Another use is monitoring your production and finding the most problematic parts of it. Production section within the production tab lists all appropriate buildings, showing their state, productivity etc. You can see if any of the buildings turned into ruins and you can see if productivity is maintained on a steady level. If productivity fluctuates, there might be issues with not enough resources being produced/delivered or with the products not being taken away in time. If there are not enough resources, production of them is too small, trade routes which deliver them are not efficient enough or warehouses near those production buildings are crowded with too many carts. Combined with trade routes section of the storage tab, the production tab allows you to pinpoint the issues of the production in your empire.
Storage tab presents how the storage of each good changes, especially stock over time section allows to monitor if your production and trade routes work well together. It also contains a lot of data about trade routes and trading in general, especially the passive version.
Finance tab's main use is managing your economy, it helps to figure out what earns you the most money, but also what costs you a lot of coins. However, it also lists all types of buildings in the game and provides specific data about each single one of them. Those include if buildings are ruined, what items affect them, what kind of items are equipped in them etc. If you can't find a specific building but you know for sure it does exist somewhere, using finance tab is a great way of finding the location of the building. When you find a record corresponding to the building you were looking for, you can click on it to get instantly teleported to its exact location in the game world.
Population tab focuses on your population and residences. It allows to monitor population fluctuations, find out if there are any supply issues, find ruined residences etc. If several residences among a long list of them have a lower level of supply it might mean that there have been some incidents recently. Or that they are further away from important public services. After finding such a residence you can instantly teleport to its location, which makes the statistics menu a great tool to find various problems within your empire.
Statistics menu is incredibly useful for managing all your items. The item tab shows where every single of your items is located and also how you can obtain every single one of them, including those which you have not found yet. Production, finance and residence tabs also contain information about buildings which are improved by items or have them equipped in their item slots.
How to access statistics?[]
There are multiple ways to get into the statistics menu. Several buttons in various buildings' UI allow you to go directly into a specific section of the statistics overview. Clicking on your balance or population in the top left bar also opens the statistics menu. Another way is using keyboard shortcuts, there is a separate shortcut for each tab of the menu:
- Production: Ctrl+Q
- Storage: Ctrl+W
- Finance: Ctrl+E or Ctrl+Y (the latter opens the "ship breakdown" which is actually the finance tab with all islands selected)
- Population: Ctrl+R
- Items: Ctrl+T
")
")
")
Selecting islands[]
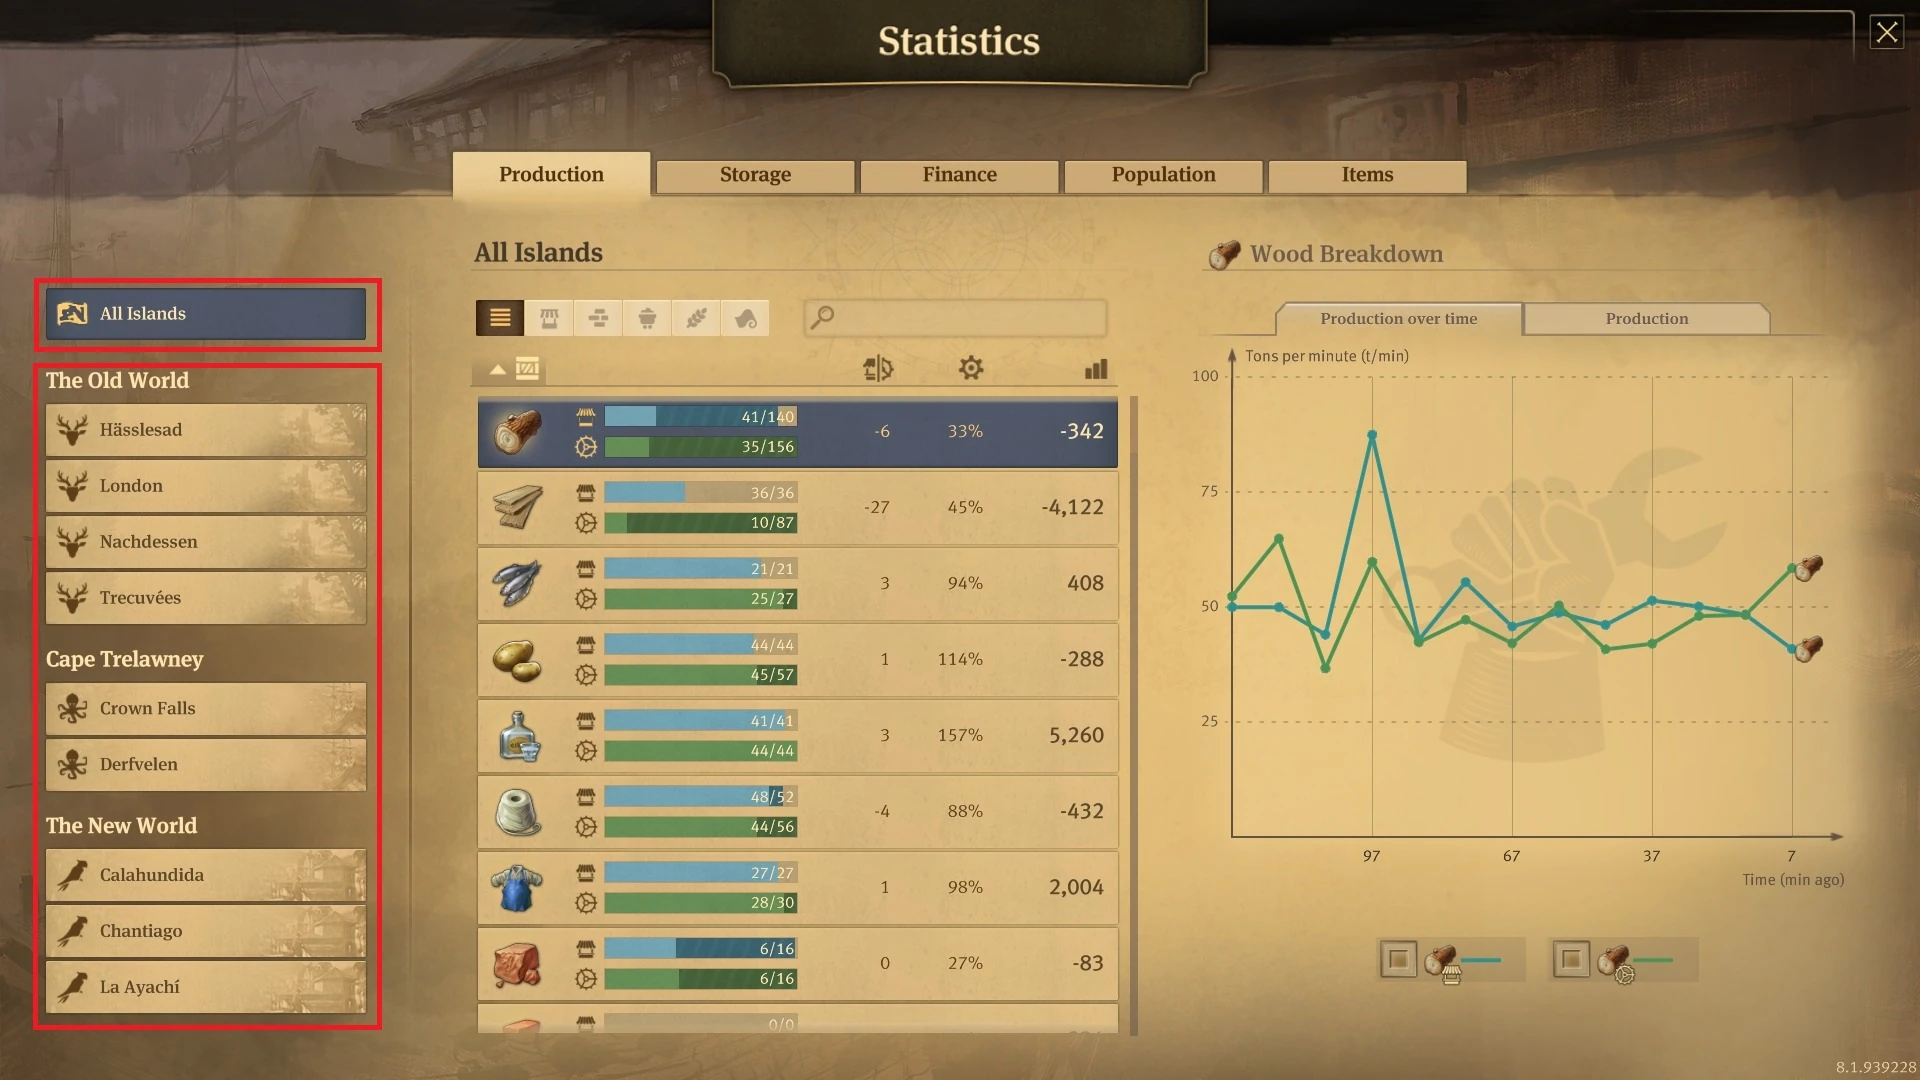
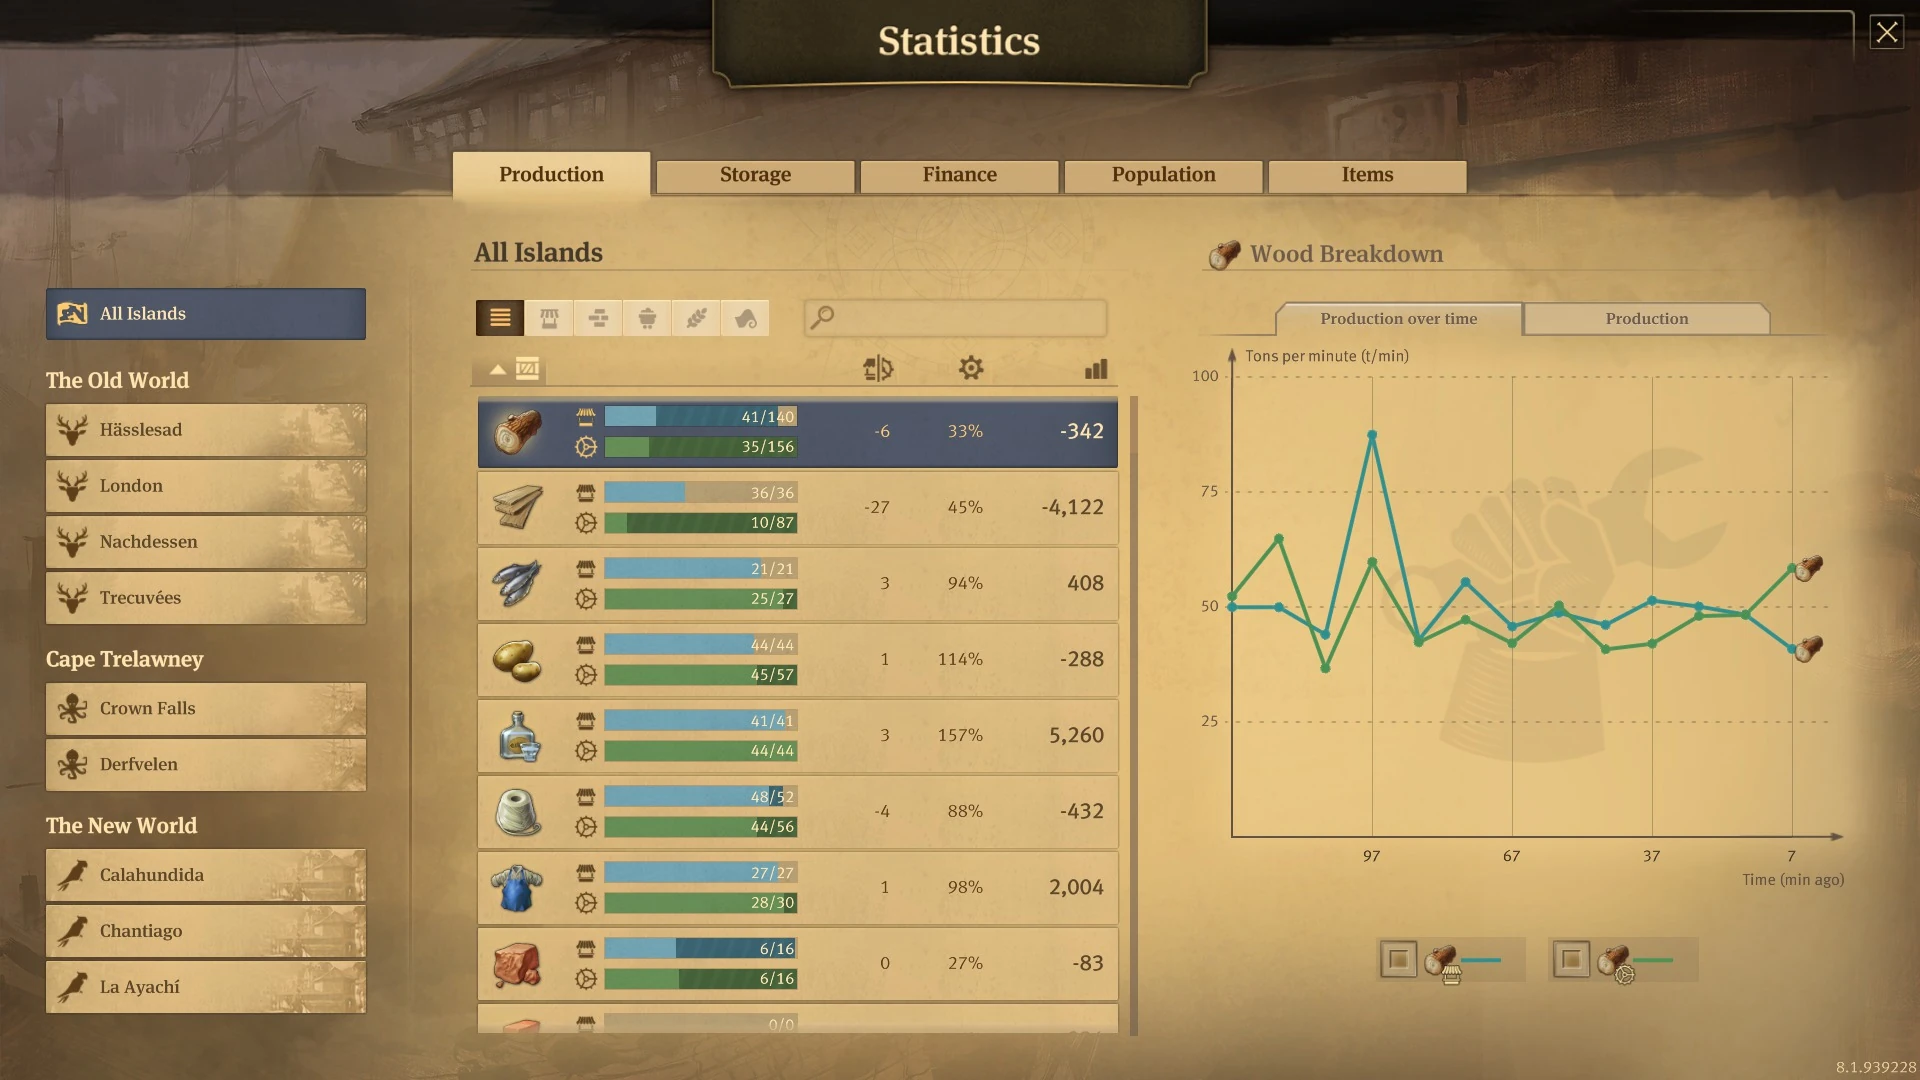
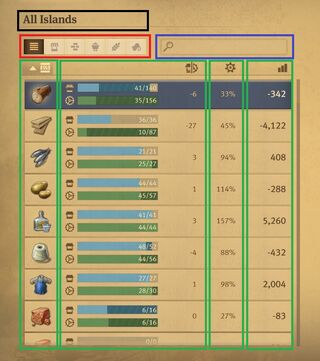
You can choose all islands, a specific island or a group of islands on the left side of the statistics menu. The middle and right parts of the menu will show information about the chosen part of your empire
On the left side of the screen you can select which islands' stats you want to see. You can see statistics of all your islands combined by selecting All Islands or you can choose a specific island. You can also select a group of islands, by holding Ctrl and left-clicking on islands you are interested on. Alternatively, you can hold Shift and left-click on two of the islands - and both those islands and all islands located in the list between those two would be selected.
Islands are divided between regions and listed in alphabetical order within each region's section. When the islands are selected, the middle and right part of the screen shows statistics of the chosen part of your empire.
Production tab[]

Statistics menu - production tab overview
The production tab shows all relevant information regarding the production and consumption of all goods. They are divided into groups in the same way like at trading posts or warehouses. You can adjust the filtering of goods at the upper part of the menu: All Goods, Consumer Goods, Construction Materials, Raw Materials, Agricultural Products, Intermediate Products.
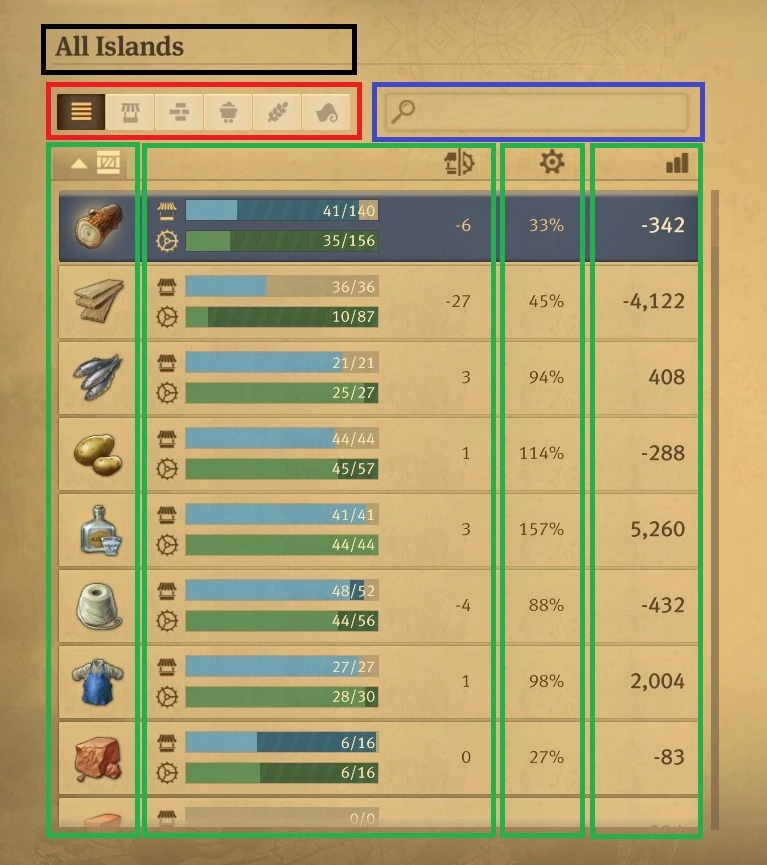
Middle part of the production tab menu. Black - selected island/islands. Red - groups of goods. Blue - search filter. Green - columns with data about goods, clicking on headers in the first row allow you to adjust the sorting.
You can also filter goods using the search filter and typing specific keywords, which consist of five groups:
- Goods - type a name of good you want to find, for example "wood"
- Population - type a name of a population tier to see all goods which production is unlocked at that tier, for example "workers" will result in the list of goods that get unlocked at workers tier such as clay, bricks, grain or iron
- Needs - type "luxury" to see only luxury consumer goods
- Working Conditions - type "worker workforce" to see all goods which are produced using workers as workforce
- Region - type "The Old World" to see all goods produced in that region
After adjusting the filtering to your needs, below you can see the list of all goods consumed or produced on the chosen island. Information about each good is displayed in four columns:
- Goods (indicated by the icon)
- Consumption/Production in tons per minute
- Productivity - average productivity of factories producing the good
- Profit
Based on one of those four criteria you can sort displayed goods in ascending or descending order by clicking on the headers of columns.
Consumption/Production in tons per minute[]

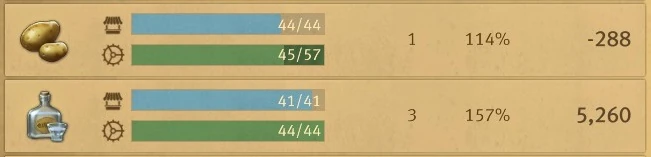
Production tab showing data about potatoes and schnapps. The green bar that represents the production of potatoes is partially darkened, current production is 45, while potential production is 57 tons per minute. Schnapps production equals consumption of potatoes, it is 44 tons per minute. The bar of schnapps production is fully bright green - all factories are fully operational, the current production is equal to the potential production. Production of schnapps is higher than its consumption so there is a slight overproduction of schnapps.
In the second column there are two bars next to each good:
- Blue bar at the top, symbolised by a market icon, which indicates the rate of consumption
- Green bar at the bottom, symbolised by a cogwheel icon, which indicates the rate of production
A part of those bars can be in full bright colours, but there can also be a striped darker part on the right. The bright left part refers to current production/consumption rate, the darker right part refers to potential rates.
At the end of each bar there are two numbers which indicate number of tons produced/consumed per minute. The first number informs about current production/consumption rate, while the second number informs about potential production/consumption rate.
Current rate refers to factories/residences which actually produce/consume the good at the moment. Potential rate refers to the situation when all your owned factories would actively produce/consume goods at their maximum productivity – all factories would be unpaused, wouldn't lack any raw materials and their storage wouldn't be full.
Next to the bars there are values which represent the net production of the good per minute (the current value only, not the potential one). It's a difference between production and consumption of the good on the chosen island. The value is positive if you produce more than consume, and negative if you consume more than you produce.
All values in this column are rounded up and displayed with an accuracy of 1 ton per minute. Therefore judging the balance between production and consumption based on those numbers is inaccurate. The most accurate way is comparing the blue consumption and green production bars - the green bar must be equal to the blue one or filled more than the blue bar to ensure that you produce enough goods to supply your further production steps or your population. Comparing how much those bars are filled is the best method of finding the perfect balance of production in your empire. The closer the bars are to being equally filled, while the green bar is still filled more than the blue, the more balanced your production is and the less overproduction you have.
However, those bars and the production tab in general, do not take trade routes or trading into account. Therefore if you import or export goods to or from the island, it is not reflected in the production tab of the statistics menu.
Average productivity[]
The third column contains average productivity of factories which produce the good on the chosen island. If all factories produce at the same rate, for example 100%, the average productivity shown in the statistics menu is 100%. If there are two factories, one paused so producing with 0% productivity, the other one with 100% productivity, then the average productivity is 50%.
Profit[]
The last column shows the profit of producing and supplying the good to your population. The value is positive if it brings you profit, and negative if it makes you lose money every minute. However, raw materials which are used only to produce other goods, and can't be supplied directly to population, will always have the negative profit value because of maintenance costs of factories. In case of each good, the profit value takes into account only the final buildings which produce the good, not the whole chain. For example, money balance from producing timber takes into account only maintenance costs of sawmills, and doesn't take into account lumberjack's huts, which supply sawmills with raw wood - the costs of lumberjack's huts are taken into account in the profit value of wood production.
Production over time[]
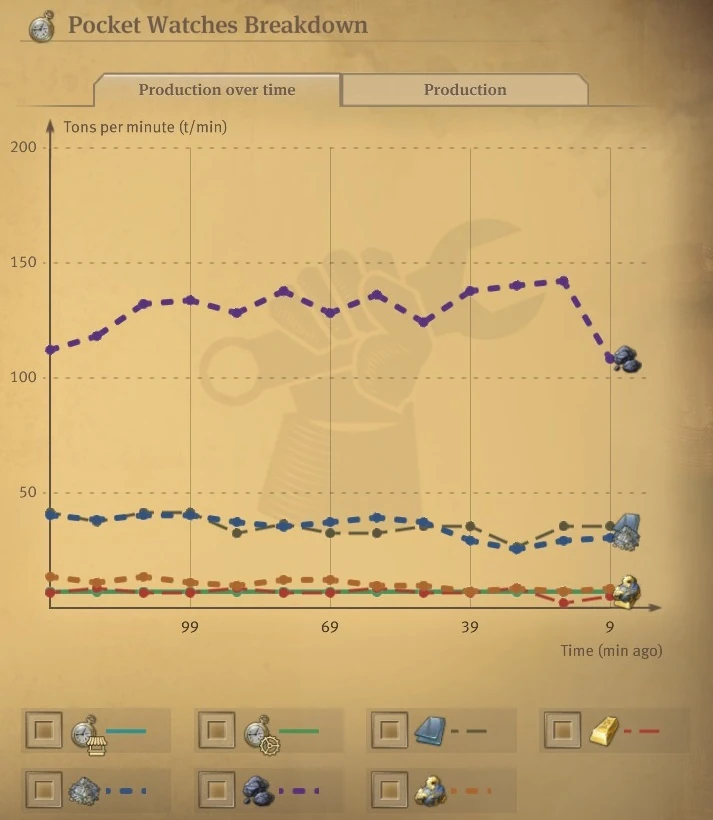
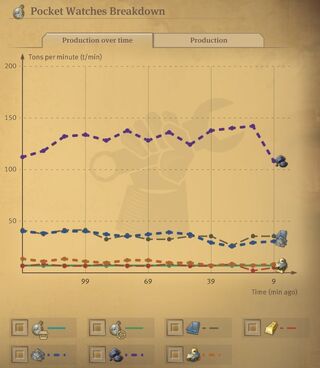
Production over time tab for pocket watches production. The graph is in the middle of the screen, points are located 10 minutes apart from each other and connected to create the plots. At the bottom there is a legend, there you can select or deselect specific lines to make them visible on the graph or to hide them
On the right side of the screen you can see more details about production of a specific good. Production over time tab contains a line graph containing several plots showing production or consumption of specific goods per minute. The X axis is time in minutes ago, the Y axis is production/consumption in tons per minute. On the right side you can see the most recent situation, the graphs don't show the current situation, only the past and they are updated every 10 minutes. Each line also contains points, which are located 10 minutes apart from each other. You can hover over any point to see what value of consumption/production per minute was at the time when the point was marked.
The solid lines refer to the good that is currently selected - green line illustrates production, blue line consumption. Dashed or dotted lines refer to raw and intermediate products that the chosen good is produced from. For example, when beer is the chosen good, you can see solid green and blue lines that indicate its production and consumption respectively. Dotted and dashed lines show production of malt, grain and hops, each line has a different colour. Below the graph you can see the legend explaining which line refers to which good, and you can select or deselect which lines you want to be displayed on the graph. The scale of the Y axis is always being adjusted to the chosen lines. You can use that to deselect goods which production/consumption is much higher than other goods, to make the lines that interest you more visible and scaled better.
Production buildings[]
The second tab on the right of the screen is called Production, it shows lists of production buildings that produce the selected good. It also includes buildings that produce the good as extra goods because of improvements applied to buildings. The data is displayed in five columns:
- Region (when several islands are selected)
- Current Productivity
- Productivity Modifiers - overall productivity boost generated by electricity, items, the palace's departments and policies etc.
- Base Productivity - the base productivity of the factory if no boosts were applied
- Workforce - the amount and type of workforce that the factory needs to operate.
Based on one of those five criteria you can sort displayed goods in ascending or descending order by clicking on the headers of columns.
The list of production buildings also clearly shows if a building is paused or ruined. You can click on any building in the list and you will be teleported to its location in the game world.
")
")
")
Storage tab[]
Statistics menu - storage tab overview
The storage tab shows all relevant information regarding storing goods, trade routes and passive trading. Goods are divided into groups in the same way like at trading posts or warehouses. You can adjust the filtering of goods at the upper part of the menu: All goods, Consumer Goods, Construction Materials, Raw Materials, Agricultural Products, Intermediate Products.
You can also filter goods using the search filter and typing specific keywords, which consist of five groups:
- Goods - type a name of good you want to find, for example "wood"
- Population - type a name of a population tier to see all goods which production is unlocked at that tier, for example "workers" will result in the list of goods that get unlocked at workers tier such as clay, bricks, grain or iron
- Needs - type "luxury" to see only luxury consumer goods
- Working Conditions - type "worker workforce" to see all goods which are produced using workers as workforce
- Region - type "The Old World" to see all goods produced in that region

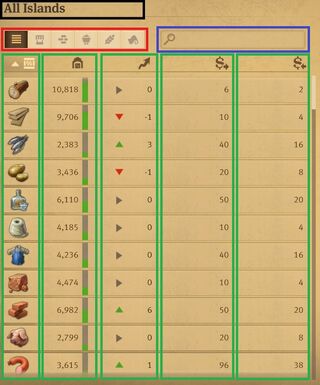
Middle part of the storage tab menu. Black - selected island/all islands. Red - groups of goods. Blue - search filter. Green - columns with data about goods, clicking on headers in the first row allow you to adjust the sorting.
After adjusting the filtering to your needs, below you can see the list of all goods with data that refers to the chosen island/islands. Information about each good is displayed in five columns:
- Type of the good (indicated by its icon)
- Current storage (in tons)
- Trend
- Purchase price (per ton)
- Selling price (per ton)
You can sort the displayed goods in the ascending or descending order based on one of those five criteria by clicking on the headers of columns.
Current storage and trend[]
The second column is your current storage in tons, either of all islands combined or one selected island. The green bar next to the number of tons indicates how much your storage is filled in comparison to its maximum capacity - the bigger the green part of the bar, the more tons of goods you have in your storage.
The third column shows the trend, which indicates how the storage of each good has been changing over last 10-20 minutes. Positive numbers mean that the stock has been increasing, negative numbers that it has been decreasing. The trend is also visually indicated by arrows on the left from the number, green arrow means increasing stock, red arrow means decreasing stock and gray arrow means that the amount of goods you have is roughly stable overtime. If the stock changes very rapidly you will see two arrows there instead of only one.
Trading prices[]
The fourth and fifth column list purchase and selling prices of goods, respectively. Those prices are the passive trading prices - the prices of goods when they are being traded when other players' ships arrive to your harbour.
More than one island selected[]
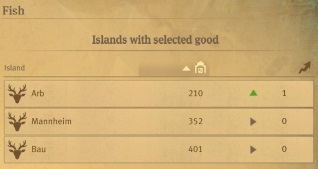
The overview of islands which have fish in storage when all islands are selected
When you select more than one island and choose specific good, on the right you will see the list of islands, which store at least 1 ton of this good. The data will be displayed in three columns:
- Symbol of the region and name of the island
- Current storage in tons
- Trend
You can sort the displayed islands in the ascending or descending order based on one of the two latter criteria by clicking on the headers of columns. You can click on one of the islands in the list and you will be immediately teleported to the trading post of the chosen island.
Only one island selected[]
When you select one island on the right you can see three tabs: Trade Routes, Passive Trade and Stock over time.
In the trade routes tab you can see all trade routes that have the chosen island as one of its stations. By clicking on specific trade route you can expand the list of past arrivals of ships which belong to this trade route (only arrivals during last two hours are shown). Each arrival displays the list of goods which were exchanged between the island's storage and the ship's cargo. Numbers next to goods' icons refer to how many tons have been added or taken from the island's storage - positive green numbers show how many tons were unloaded from the ship into the island's storage; negative red numbers show how many tons were loaded onto the ship from the island's storage. On the far right you can see how much time has passed since the last time when the ship exchanged the cargo with the island. You can click on the symbol on the right side of the trade route bar and the game will open the trade route menu, showing you the chosen route.
The passive trade tab shows a list of other players who recently traded any goods at the harbour of the chosen island. You can click on one of the players to expand a list of trades which were made with them at this island. Each trade record shows amount of coins earned/spent, amounts and types of goods exchanged and also how long ago the trade was made.
Selecting a specific good from the list will show you only those trade routes and passive trades that involve the chosen good. Having a specific good selected also unlocks the last tab - stock over time, which shows a graph that illustrates how the stock of the chosen good has been changing recently. The Y axis shows the stock in tons, the X axis shows the time in minutes ago. On the right side you can see the most recent state of stock, the graphs don't show the current situation, only the past and they are updated every 10 minutes. Each line also contains points, which are located 10 minutes apart from each other. You can hover over any point to see what amount of goods was in the storage at the time when the point was marked.
If the selected island has Docklands Main Wharf built, on the bottom right below the tabs there is a button Go to Docklands Main Wharf, which opens the export/import menu for Docklands on that island.
")
")
")
")
Finance tab[]
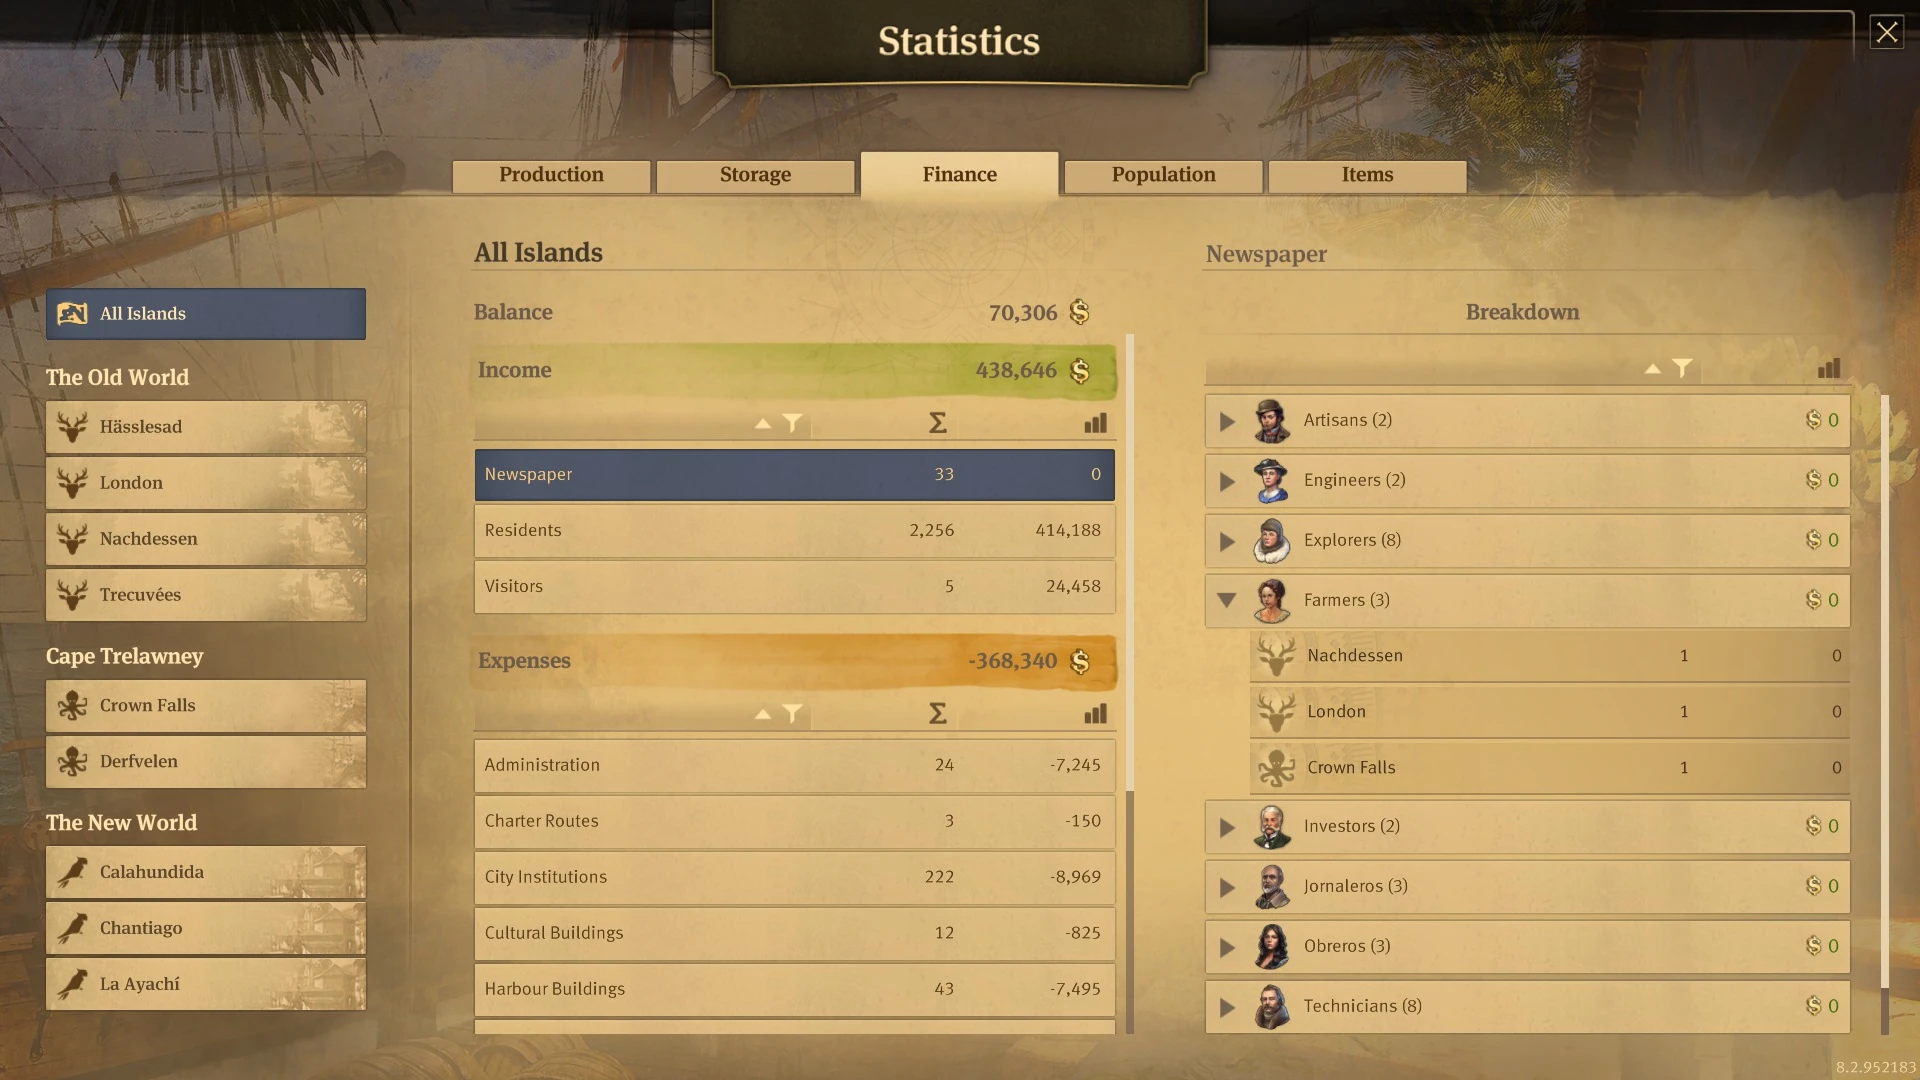
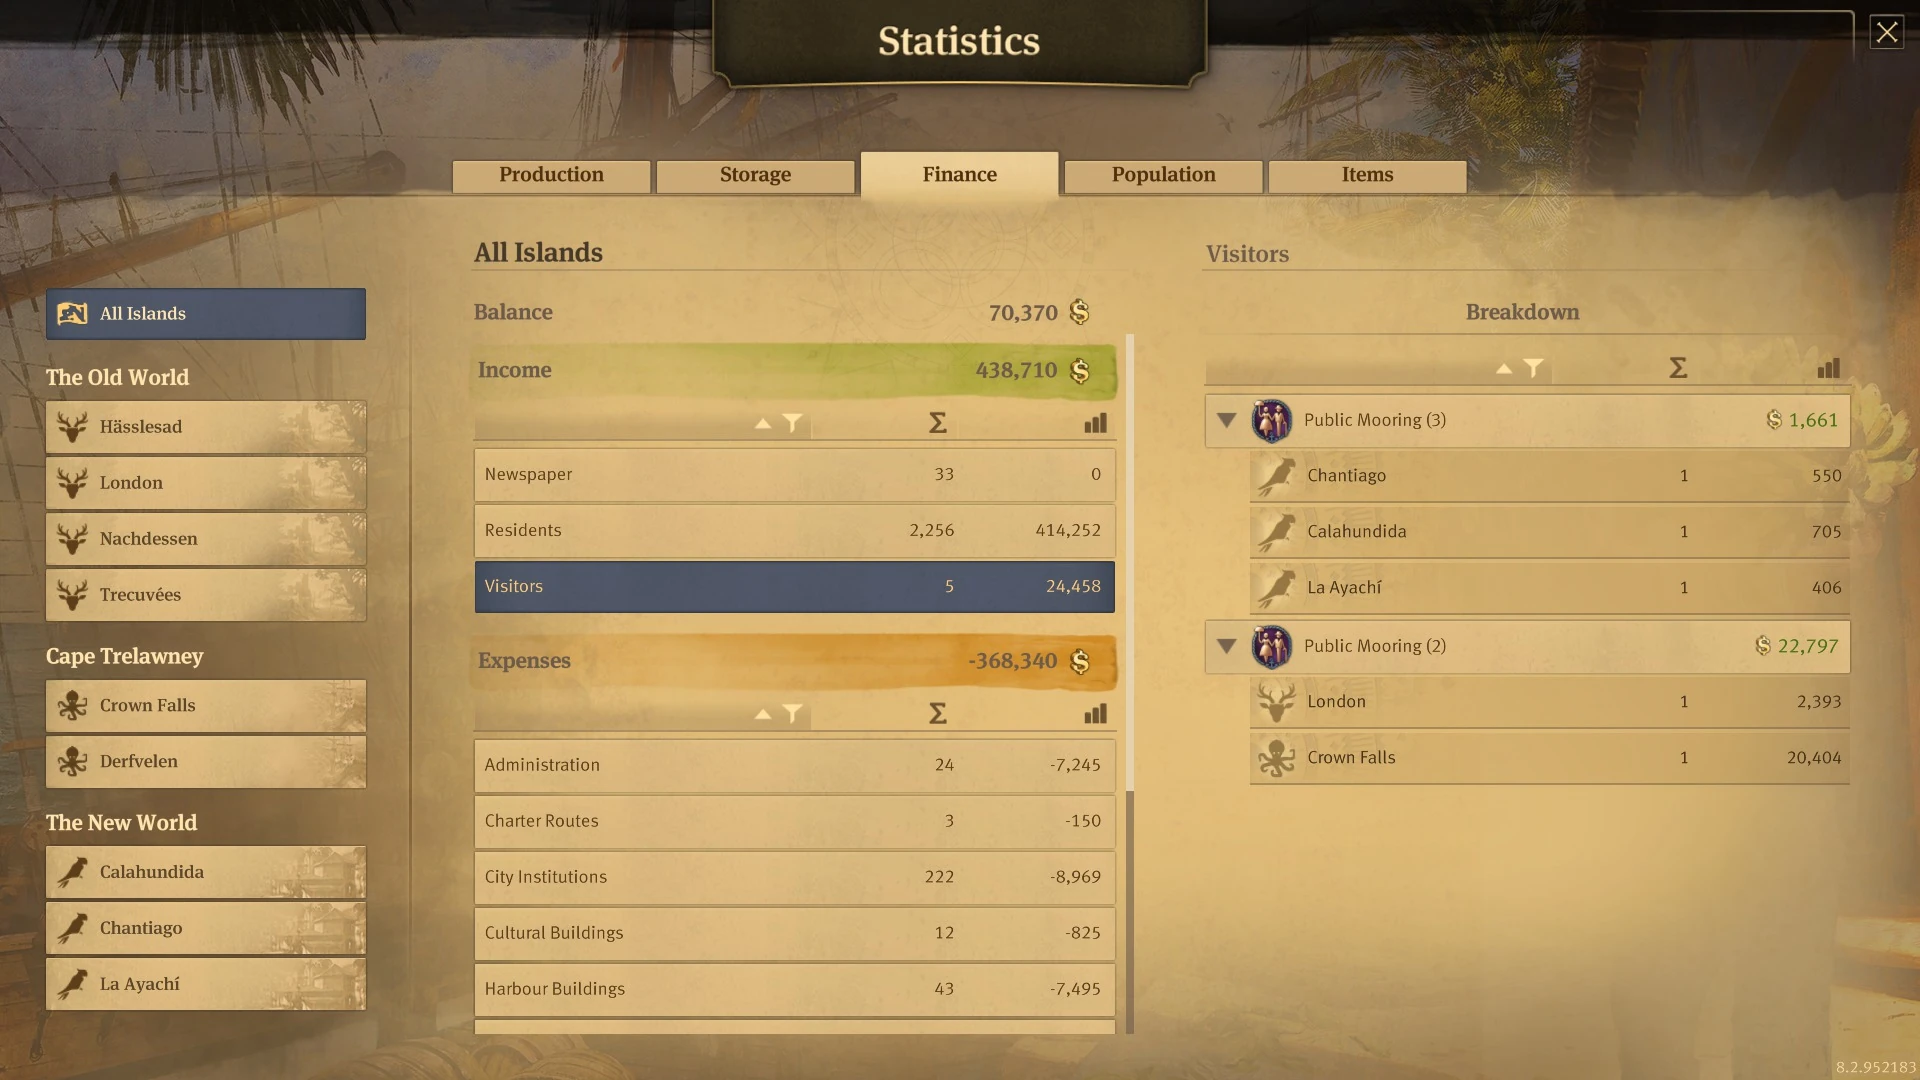
Statistics menu - finance tab overview
The finance tab shows all relevant information regarding the economy of your empire. At the top you can see the overall balance, either for several islands or only for the specific island. Below the menu is divided into income and expenses sections, where data is displayed in three columns:
- Source of income - everything that can generate income or has maintenance costs
- Amount - number of buildings or objects in the category
- Balance - total balance generated by all buildings/objects in the category
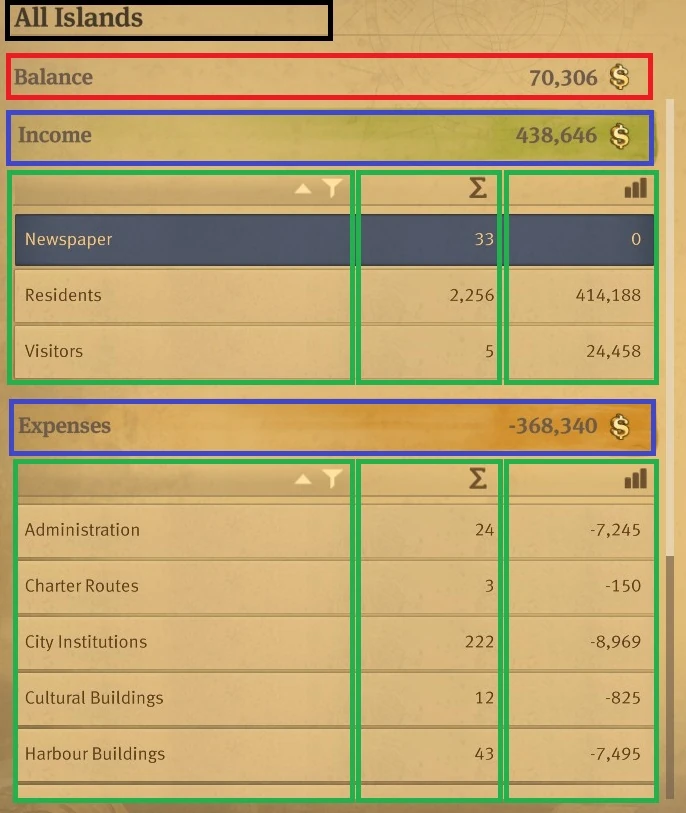
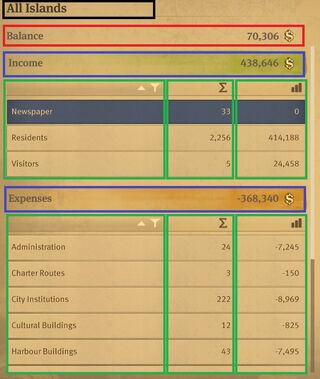
Middle part of the finance tab menu. Black - selected island/islands. Red - overall balance. Blue - income and expenses. Green - columns with data about sources of income, clicking on headers in the first row allow you to adjust the sorting.
You can sort the displayed sources of income in the ascending or descending order based on one of those three criteria by clicking on the headers of columns. You can select one of the sources of income/expenses and then on the right you can see more details about the chosen source.
Sources of income
The first column contains all sources of income in the game, there are three sources generating money and having positive balance and several sources which cost money and have negative balance.
Sources with positive balance - income section:
- Newspaper - income generated by articles which boost income from your population
- Residents - income from your population, the amount indicates the number of residences
- Visitors - income generated by tourists, the amount indicates the number of public moorings
Sources with negative balance - expenses section:
- Administration - item buildings, palace and local departments
- Charter Routes - list of all charter routes across all regions
- City Institutions - institutions which fight with incidents like fire or illness
- Cultural Buildings - zoos, museums, botanical gardens, World's Fairs and Research Institute
- Harbour Buildings - all harbour buildings such as shipyards, repair cranes, piers etc., including modules of the Docklands
- Infrastructure - depots, oil harbours, warehouses
- Shares - list of AI opponents and your islands where they possess shares
- Production Buildings - all production buildings and multifactories - buildings which produce goods
- Public Services - all public buildings which fulfill your people's needs
- Royal Taxes - amount of royal taxes paid to the Queen, divided between each population tier
- Trade Ships - list of trade ships, divided into groups based on ship type
- War Ships - list of war ships, divided into groups based on ship type
- Skyscraper Maintenance – list of skyscrapers, divided into groups based on population tier and skyscraper level
- Food & Drink Venues – list of food & drink venues
- Shopping Arcades – list of shopping arcades
Balance breakdown
Having a specific source of income selected in the middle part of the menu, opens its breakdown on the right side of the menu. The data is displayed in several columns, the first one is always the source of income, the last is always balance. There might be some columns in between, which depends on what type of source of income you selected. Those additional columns include: Amount, Productivity, Supply, Health Points, Damage per Second. Based on each of the above mentioned criteria you can sort displayed sources of income in ascending or descending order by clicking on the headers of columns.
More than one island selected[]
Balance breakdown shows all public mooring located on all player's islands. They are divided into two groups: the first one shows New World public moorings, the second one shows Old World and Cape Trelawney public moorings; the region is indicated by its icon next to the island's name.
When more than one island is selected the balance breakdown lists sources of income, the number in brackets corresponds to the overall amount of income sources from that category. Income sources are divided between regions, for example after selecting administration, in the balance breakdown you might see two Trade Union lists, one of them would contain the New World Trade Unions and the other the Old World Trade Unions. It is important to note that Old World and Cape Trelawney are treated as the same region in the balance breakdown. When you expand one of the lists, you will see a list of islands which contain selected source of income. The name of the region is not displayed in the list header but on the left from the island's name there is an icon of the region where the island is located.
")
")
")
")
")
")
")
")
Only one island selected[]

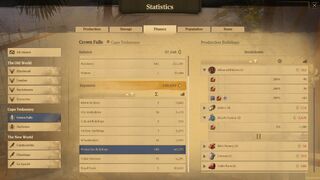
Balance breakdown shows all production buildings located on specific island (Crown Falls). Two of the groups are expanded: artisanal kitchens and bicycle factories. The breakdown shows bonuses, item effects, productivity and maintenance cost of each single production building separately. The pause symbol indicates that one of the bicycle factories is paused. You can click on the record of a specific production building to teleport to its location in the game world.
When a specific island is selected the balance breakdown lists sources of income divided between the types of sources. By clicking on specific type of source you can expand the list of each source of income that the selected island contains. Every record provides more details such as item effects or productivity. You can click on any source of income to teleport to its location in the game world (if possible). If the source of income is a building, the list of them at the income breakdown also clearly shows if a building is paused or ruined.
Finance statistics of a specific island don't include data about charter routes, shares, trade ships and war ships. Those can be investigated only from perspective of the All Islands selection.
")
")
")
Population tab[]
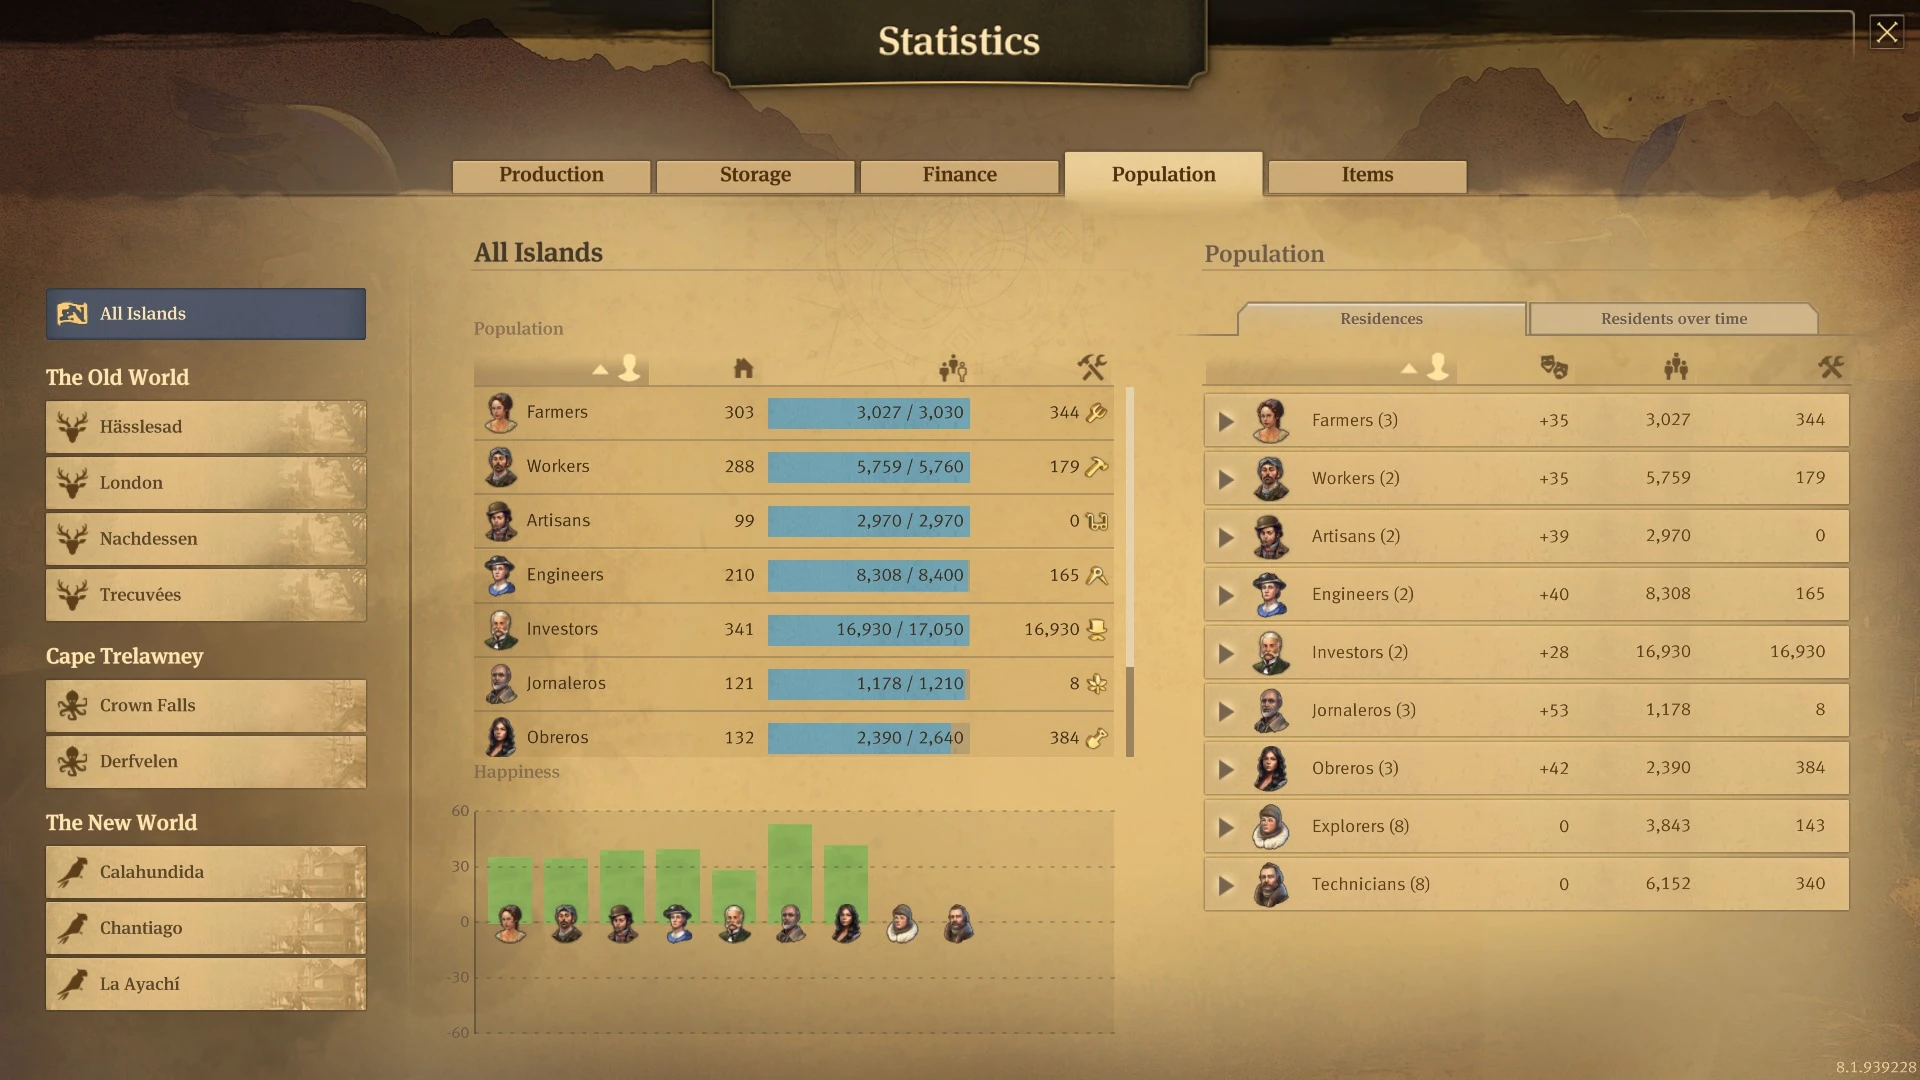
Statistics menu - population tab overview
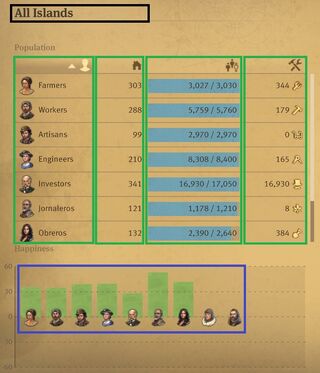
The population tab shows all relevant information regarding your population. The middle part of the menu is divided into two separate sections: population and happiness. The first section, population, lists all population tiers living on the chosen island. Information about each tier is displayed in four columns:
- Resident Tier - icon and name of the tier
- Residences - number of residences of the tier
- Current Population - current population of the tier / maximum population of the tier if all existing residences were full. The blue bar indicates how many people all your residences house in comparison to their maximum capacity - the bigger the blue part of the bar, the closer your current population is to the maximum population.
- Workforce - workforce balance of the tier, which equals to workforce generated by houses and bonuses minus workforce utilized in various buildings

Middle part of the population tab menu. Black - selected island/islands. Green - columns with data about population tiers, clicking on headers in the first row allow you to adjust the sorting. Blue - happiness of each population tier.
Based on one of those four criteria you can sort displayed population tiers in ascending or descending order by clicking on the headers of columns.
When a specific island is selected and it shares workforce with other islands via commuter piers, its workforce column has a blue background.
The second section, happiness, is a vertical bar graph which displays the average happiness level of each tier living on the chosen island. Average happiness is represented by the length and colour of the bar. The longer the bar the higher the happiness value, while the colour indicates if the value is positive or negative - green bar rising above resident's portrait means positive happiness, red bar dropping below the portrait means negative happiness. You can hover over each bar to see exact happiness value.
On the right side of the menu there are two tabs showing more detailed information.
Residences[]
The first tab on the right of the screen is called Residences, it provides details about residences of each tier. The data is displayed in four columns:
- Resident Tier
- Happiness
- Current Population
- Workforce/Average Supply - workforce when several islands are selected; average supply when a specific island is selected
Based on one of those four criteria you can sort displayed population tiers in ascending or descending order by clicking on the headers of columns.
When several islands are selected the residences tab contains lists of islands where specific resident tier lives, the number in brackets corresponds to the number of islands. When you expand one of the lists, you will see a list of islands which are housing the chosen tier. The icon on the left from the island's name symbolises the region where the island is located. You can click on any island in the list and you will be teleported to its trading post location.
When a specific island is selected the residences tab contains lists of residences divided between resident tiers, the number in brackets corresponds to the number of residences. By clicking on a specific tier you can expand the list of that tier's residences that the selected island contains. Every record provides more details about each residence such as bonuses, item effects, population living inside and average supply. The list of residences also clearly shows if a residence is ruined. You can click on any building in the list and you will be teleported to its location in the game world.
")
")
Residents over time[]
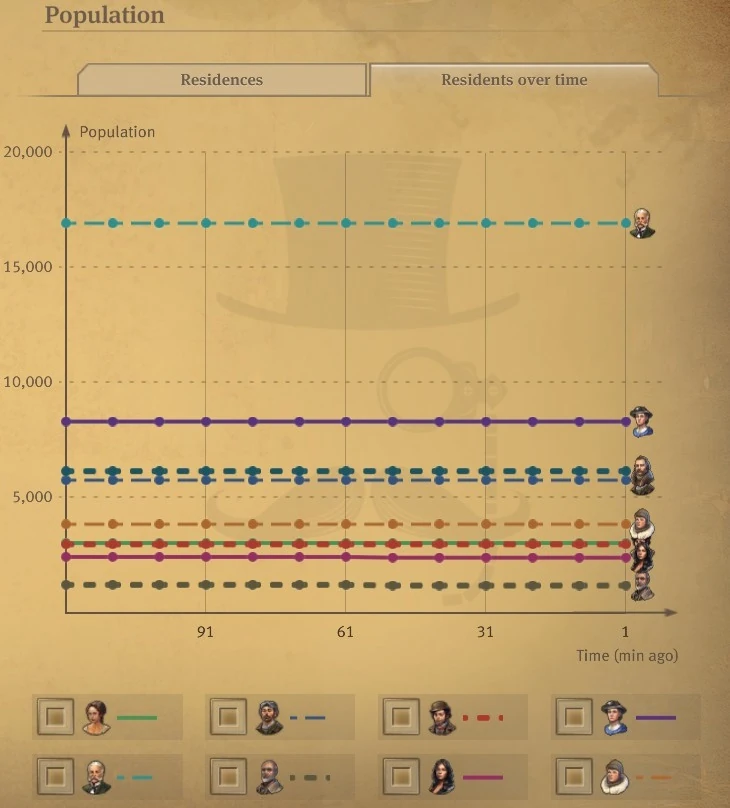
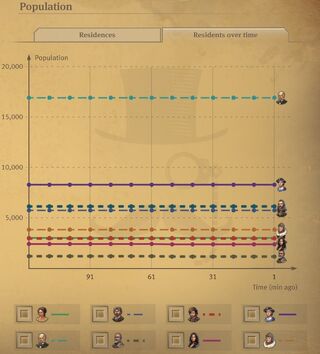
Residents over time tab for all islands. The graph is in the middle, points are located 10 minutes apart from each other and connected to create the plots. At the bottom there is a legend, there you can select or deselect specific lines to make them visible on the graph or to hide them
The second tab on the right of the screen is called Residents over time, it provides details about how the population of each tier has been changing over time. It consists of a line graph containing several plots showing amount of population. The X axis is time in minutes ago, the Y axis is population. On the right side you can see the most recent situation, the graphs don't show the current situation, only the past and they are updated every 10 minutes. Each line also contains points, which are located 10 minutes apart from each other. You can hover over any point to see what amount of population was at the time when the point was marked.
Each line corresponds to a different resident tier. Below the graph you can see the legend explaining which line refers to which tier, and you can select or deselect which lines you want to be displayed on the graph. The scale of the Y axis is always being adjusted to the chosen lines. You can use that to deselect resident tiers which population is much higher than in case of other tiers, to make the lines that interest you more visible and scaled better.
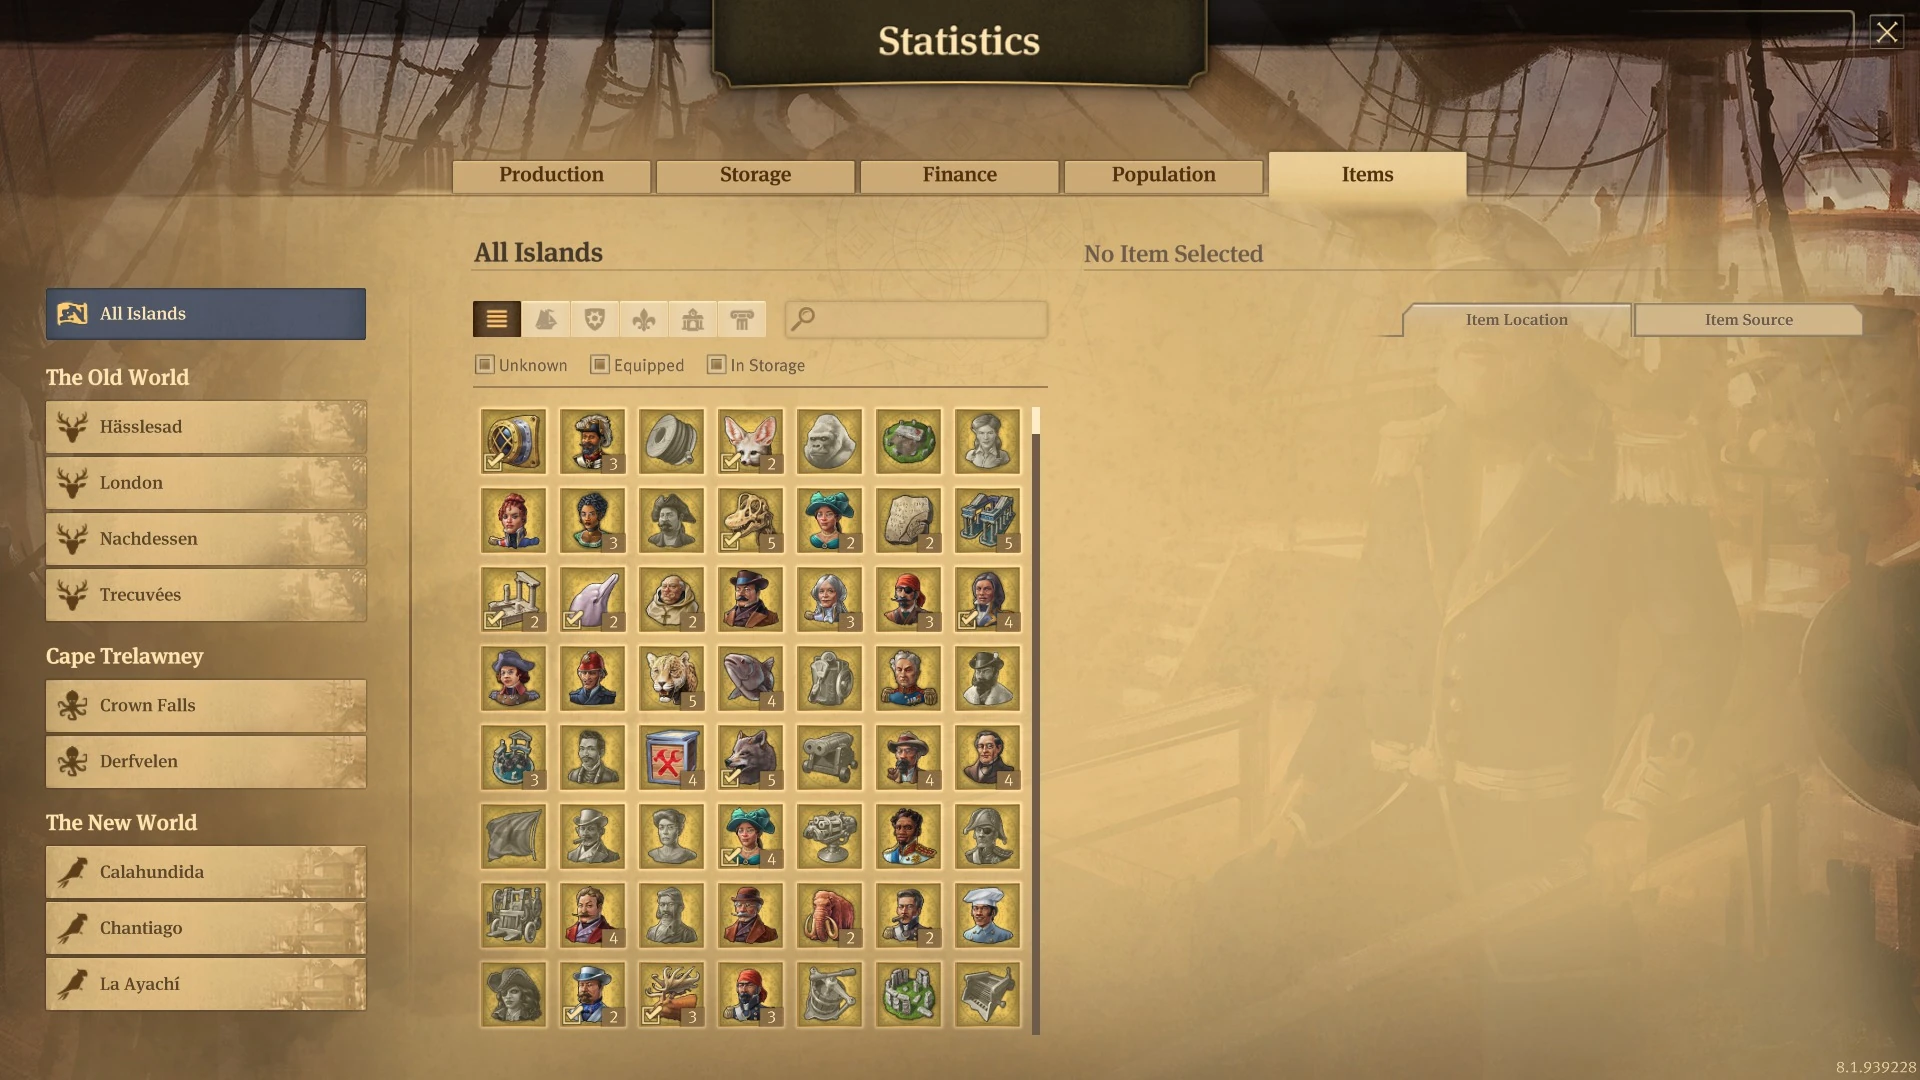
Items tab[]

Statistics menu - items tab overview
The items tab shows all relevant information regarding your items across your empire. They are divided into groups in the same way like at trading posts or warehouses. You can adjust the filtering of items at the upper part of the menu: All Items, Ship Items, Trade Union Items, Harbourmaster Items, Town Hall Items, Cultural Items.
You can also filter items using the search filter and typing specific keywords, such as item names, buildings or objects they affect, items effects etc. When not using specific keywords, the filter will look for items which name contains the text you entered.

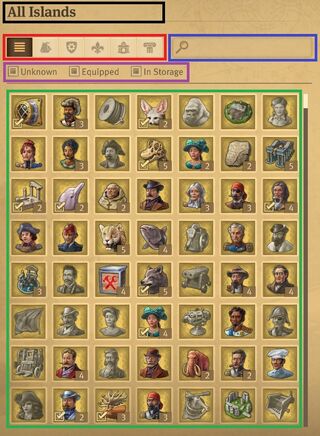
Middle part of the items tab menu. Black - selected island/islands. Red - groups of items. Blue - search filter. Purple - status of items. Green - list of items, each item is represented by its icon with a background matching item's rarity.
Additionally, you need to choose status of items which you want to include in the overview. Below the item groups there are three (four) boxes you can select or deselect, they correspond to following status of items:
- Unknown - items which you have not had in your possession yet
- Equipped - items which are currently equipped in any item slot of any objects/buildings
- In Storage - items which are currently stored in any trading posts or ships
- Identified – items which have been discovered and can be developed via research; this box is present only if Land of Lions DLC is active
Each of those status selections are separate and independent. Having two boxes selected means that all items from each of those selections are shown. Having all boxes selected means that all items available in the game within the chosen item group are shown.
After adjusting the filtering to your needs, below you can see the lists of items which meet chosen criteria. Each item is represented by its icon with a background which colour corresponds to the item's rarity. If the icon is grayed out, the item is unknown, has not been obtained yet. If in the bottom left corner there is a tick, it means the item is equipped in an item slot somewhere. If you have more then one item, there is an appropriate number in the bottom right corner of the icon. Note that this number only indicates the amount of items that match selected status. For example when one item is equipped in a building and you have also three more such items in storage, when In Storage status is selected, the item overview will show that you have three such items (in storage), despite having a fourth one equipped in a building. If Land of Lions DLC is active, in the top left corner there is a flask icon, if the item is identified and can be developed via research.
Hover over any item to see its details in form of a infotip, you can also click on any item to see its details on the right side of the menu. On the right side there are also see two tabs: Item Location and Item Source, both providing valuable information about the selected item. If Land of Lions DLC is active, at the bottom below item's details, item location and item source tabs, there is information about research options regarding selected item.
")
")
")
")
")
")
Item Location[]
The first tab on the right is called Item Location, it provides information about where each single item you own is located.
When several islands are selected the item location tab contains list of regions and islands where selected item is located, the numbers on the right correspond to the number of items located in a specific region/island. When you expand one of the region's lists, you will see a list of ships which have the selected item on board or in their item slot. When you expand one of the island's lists, you will see a list of buildings which have the selected item in their item slots or in their storage (trading posts). The icon on the left from the island's name symbolises the region where the island is located. You can click on any ship or building from the lists and you will be teleported to its location in the game world.
When a specific island is selected the item location tab simply contains lists of buildings which have the selected item equipped in their item slots or in their storage (trading posts), numbers on the right correspond to the number of items located in a specific building. You can click on any building from the list and you will be teleported to its location in the game world.
")
")
")
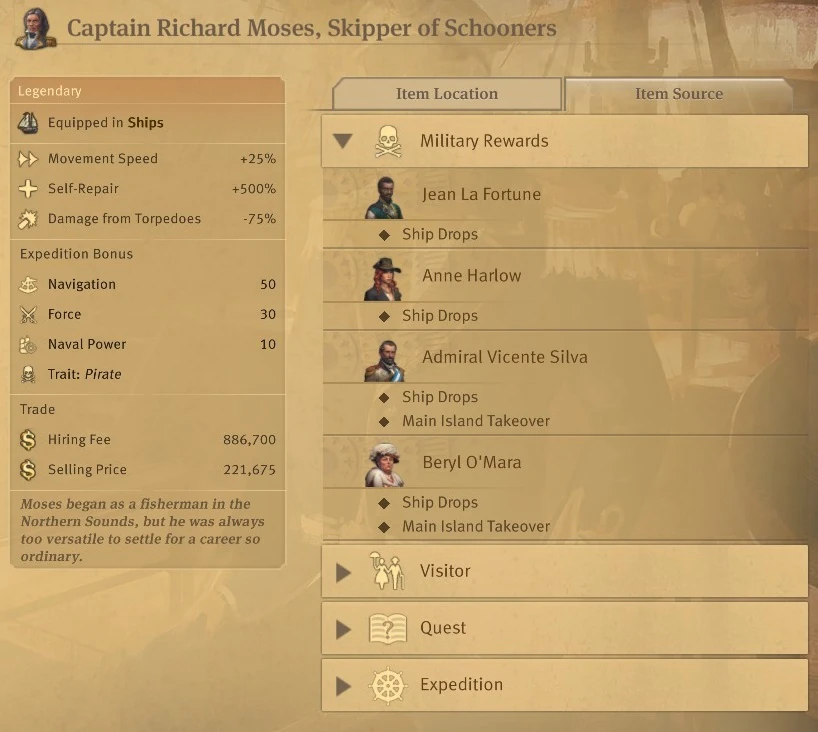
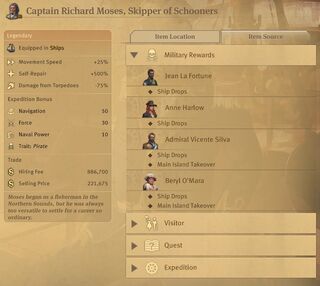
Item Source[]
Item Source tab presenting all possible sources of the selected item. Military Rewards is expanded to show more details about this type of sources.
The second tab on the right is called Item Source, it provides information about how and from what sources you can obtain the selected item. You can click on any of the sources to see more detailed list of specific sources.
List of possible sources with their explanation:
- Diving
- Open Sea - diving with the salvager at random diving spots
- Treasure Maps - specific treasure maps which completion can result in retrieving the item
- Expedition - all types of expeditions which can provide the item as a reward
- Lost Arctic Cargo - collecting golden crates at the ice desert in the northern part of the Arctic (using airships)
- Military Rewards - list of AI opponents whose ships or islands can be the source of the item upon being destroyed
- Ship Drop - destroying AI's ships
- Main Island Takeover - taking over AI's main islands (those which have lighthouse in their harbour)
- Secondary Island Takeover - taking over AI's secondary islands (those which do not have a lighthouse)
- Monument - types and levels of World's Fair exhibitions which can grant the item as a reward
- Quest - all characters (residents, AI opponents, neutral parties) whose quests can award the item upon completion
- Research Institute - research allows to create this item once it is identified
- Trader - neutral traders who can sell the item at their harbour
- Transmuting - crafting the item at one of Old Nate's workshops (Sunken Treasures DLC icon - Cape Trelawney workshop, The Passage DLC icon - The Arctic workshop)
- Visitor - the item can be obtained at a public mooring when a special visitor arrives
- Specific attractiveness rating - to obtain the item island's attractiveness rating must be within a certain range
- Special visitor pools - items or bonuses which unlock special visitor pools which contain the item
")
")
")
")
")
")
")
")
")
Research options[]
If Land of Lions DLC is active, on the bottom right of the items tab there is a bar with information about research and item development options for the currently selected item. The bar may indicate several different statuses:
- This item cannot be developed - when selected item cannot be obtained via item development via research
- Old Nate's invention cannot be identified – when selected item is one of the Old Nate's inventions, which cannot be developed via research. There is a small "jump to location" button on the bar on the right from the text - click on it to be teleported to Old Nate's workshop where the item can be created
- Item identified - when selected item has been identified and the research institute is available to develop the item. On the right side there is a large "Go to Research Institute" button which opens up the item development research menu with the same item already selected
- Use Research Kit button - when selected item has not been identified for research yet but at least one research kit is available and you already have at least one copy of that item in your possession. Click the button to instantly identify the item, it uses up one research kit.
- Identify this item - when selected item has not been identified and no research kits are available, or research kit is available but the item is not in your possession. On the right there is a "Go to Research Institute" button, click on it to open fields of research section of the research menu, where you can identify more items by spending research points.
- Another item is being developed - when selected item is identified but the institute is busy researching something. In the middle there is a timer indicating for how long the institute will be busy. On the right there is a "Go to Research Institute" button, clicking on it opens the item development research menu with the item which was selected in statistics menu being also already selected in the research menu.